

User Manual
awaBerry | Edit Automation Project
Configure every aspect of a Smart Automation project: name, description, prompts, schedule, messaging, environment variables, and agent type.
Edit Automation Project
Summary
The Edit Automation Project screen is where a Smart Automation project is fully configured. You can set the project name and description, write the main execution prompt, choose between single-agent and executor mode, define environment variables (including references to other projects), select an execution schedule (daily, weekly, or never), pick messaging notification preferences, control portal visibility, and view or trigger past execution results. Unsaved changes are tracked and a save prompt is shown if you try to leave with pending edits.
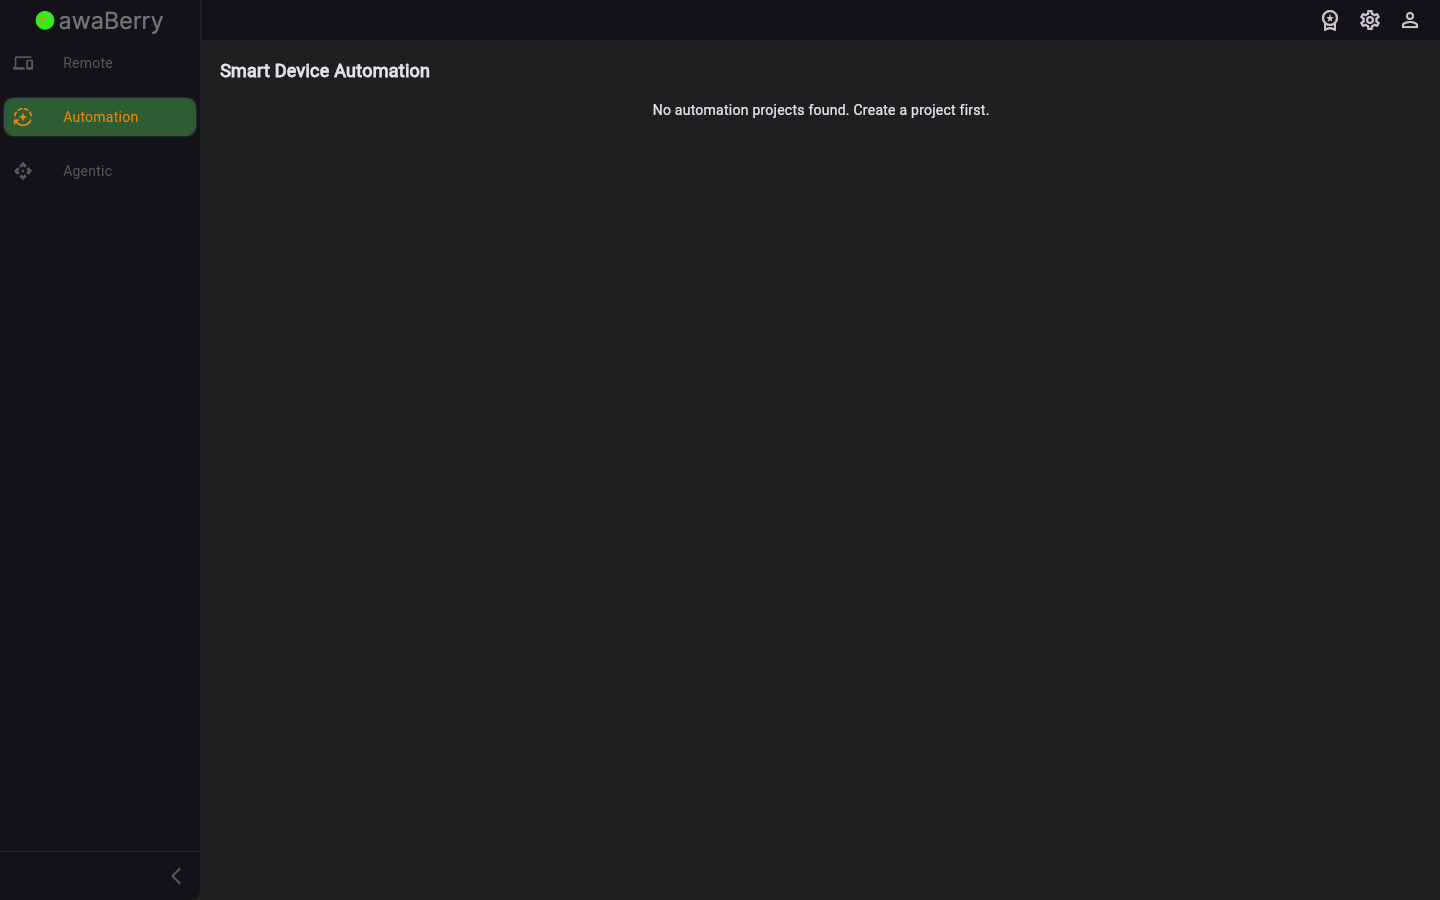
Screen on arrival
Features
- AppBar title — mirrors the project name (shows "Loading project" until data is fetched).
- Project Name TextField (
_projectNameController) — the human-readable name shown in the Project Overview list. - Project Description TextField (
_projectDescriptionController, multiline) — a short summary describing what the project does. - Active Switch — enables or disables scheduled execution for this project.
- Display in Portal Checkbox — controls whether this project appears on the published portal page.
- Agent Type Dropdown — selects either:
- Single — one main prompt drives the entire automation run.
- Executor — this project orchestrates a sequence of other automation projects, executing them in order.
- Prompt TextField (
_mainPromptController, multiline, Single mode only) — the primary natural-language instruction the AI model executes. A full-screen markdown editor button opens an expanded editing view. - Executor mode — referenced project list (Executor mode only) — a reorderable list of other automation projects that will be run in sequence:
- Each entry shows the referenced project name with a drag handle for reordering.
- Add project to execute button — appends another project reference to the sequence.
- Delete button removes a project from the sequence.
- Optimize Execution message block — describes how the executor optimises the run order.
- Execution Commands message block — shows the commands that will be issued to each referenced project.
- Create/Recreate execution setup refresh icon — opens a popup to create (first time) or recreate (already exists) the execution scaffolding on the device.
- Execution Dropdown — schedule options:
- Never — the project runs only on manual trigger.
- Daily — runs at the selected hours every day.
- Weekly — runs at the selected hours on the selected days.
- Hour Selector (shown when execution is daily or weekly) — a row of hour buttons (0–23); tap to select/deselect individual hours for the scheduled run.
- Day Selector (shown when execution is weekly) — buttons for Mon–Sun; tap to select/deselect the days the project should run.
- AI Model selectors — dropdowns for:
- Model for logic creation (default: Gemini or Claude Sonnet) — the AI model used to write/refine automation logic.
- Model for logic execution (default: Gemini Flash or Claude Haiku) — the AI model used during actual scheduled runs.
- Messaging Dropdown — notification channel after each run: No messaging, Email, Slack, or Twitter.
- Environment Variables section — key/value pairs passed into the automation at runtime:
- Key TextField and Value TextField per entry.
- Value visibility toggle (eye icon) per entry; master "show all values" toggle.
- Add env variable button appends a new blank row.
- Add project reference button inserts a reference to another automation project as a special env variable.
- Delete button removes an individual entry.
- Save button — persists all changes to the device backend. Shows "Saving…" with a spinner while the request is in-flight. After save the Project Overview list is refreshed.
- Execution result panel — shows the last execution status, date, and a button to view the full HTML result or raw JSON result. A separate button opens the Gemini execution log.
- Update result button — opens a full-screen view where you can manually trigger or review the result update.
- Unsaved-changes guard — if you navigate away with unsaved changes, a prompt asks whether to discard or stay.
Scenarios
Update the prompt and save
- Open a project from the Project Overview (pencil icon).
- Tap into the Prompt field and revise the instruction text. Use the expand icon to open the full-screen markdown editor for longer prompts.
- Tap Save. A spinner is shown while the backend persists the change.
- On success you are returned to the Project Overview with the updated project data.
Set up a weekly schedule
- Open the Execution dropdown and select Weekly.
- Tap the desired days (e.g. Mon, Wed, Fri) in the Day Selector row.
- Tap the desired hours (e.g. 6, 12) in the Hour Selector row.
- Tap Save to apply the schedule.
Add environment variables
- Scroll to the Environment Variables section.
- Tap Add env variable to create a new blank key/value row.
- Enter the variable name in the Key field and its value in the Value field. Use the eye icon to reveal or hide the value.
- Repeat for additional variables. Tap the delete icon to remove any entry.
- Tap Save to persist all variables.
Set up an Executor project
- Open the Agent Type dropdown and select Executor.
- The prompt field is replaced by the referenced project list. Tap Add project to execute to add other automation projects.
- Drag the project entries to reorder them — they will run in the listed sequence.
- Tap the Create execution setup refresh icon to generate the execution scaffolding on the device (or Recreate if it already exists).
- Tap Save.
View the last execution result
- In the execution result panel, the last run date and status are shown.
- Tap View HTML result to see the formatted output in a full-screen HTML viewer.
- Tap View JSON to inspect the raw result data.
- Tap View execution log to open the detailed AI execution log.