

Get real-time, at-a-glance visibility into every connected device's health and performance — no log-digging required. Color-coded indicators, live process tracking, and full hardware and network overviews give you everything you need to stay ahead of issues.
Products: awaBerry Anywhere — Remote
Key Features
Everything you need to stay ahead of issues — available the instant you open the dashboard.
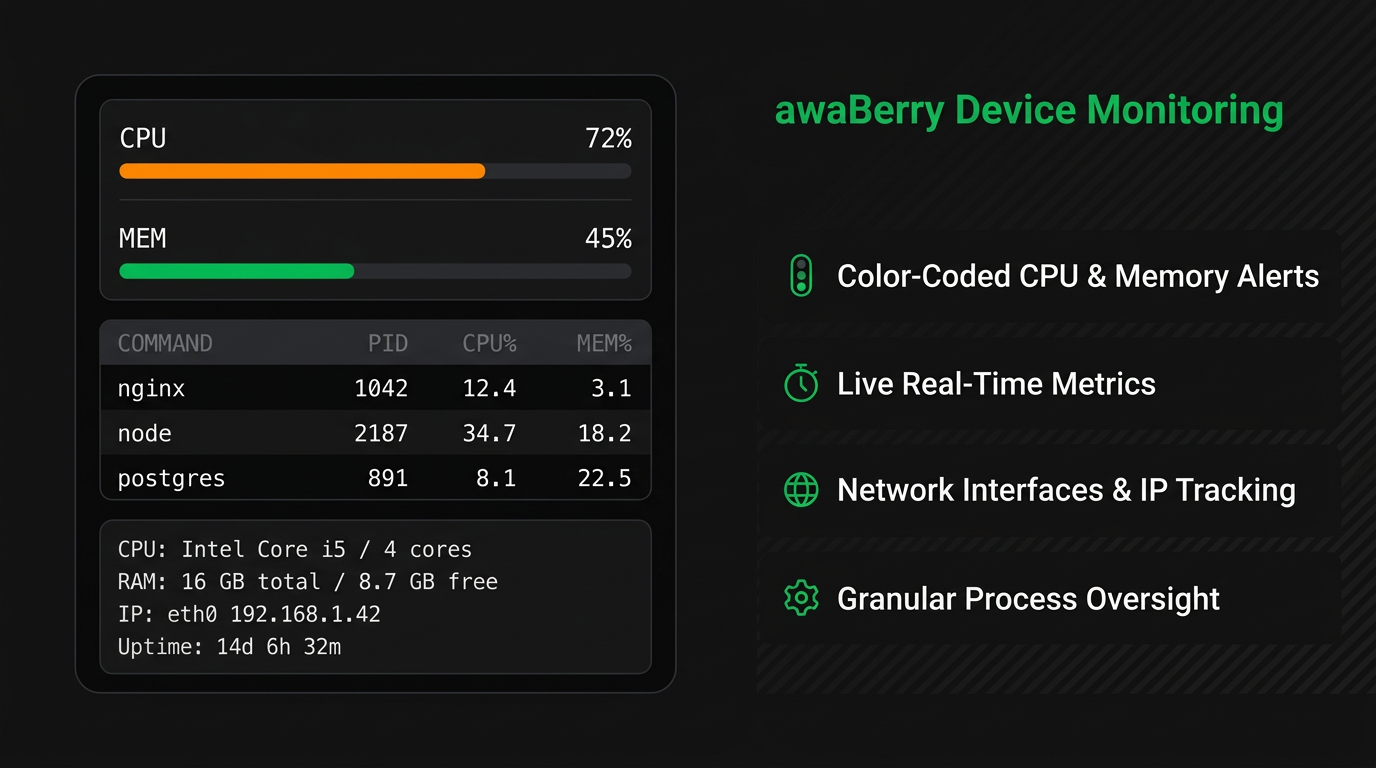
🚦 Visual System Health (CPU & Memory)
CPU load and memory usage are displayed with color-coded traffic-light indicators (green / orange / red). Spot resource bottlenecks the instant you open the dashboard — no interpretation needed.
📋 Granular Process Tracking
A live task list shows every active process with command name, PID, CPU%, and MEM% usage. Pinpoint exactly which processes are consuming resources and act immediately.
🖧 Comprehensive Hardware & Network Overview
All critical device data in one panel: CPU model and core count, total and free RAM, network interfaces (type, IP address), and system uptime continuously tracked.
⏱️ Real-Time Refresh
Metrics update in real time — no manual refresh needed to get current data during an incident. Always accurate, always live.
Key Benefits
Stay Ahead of Issues
Visual Alerts
Color-coded CPU & memory indicators — green means go, orange means watch, red means act. No metric reading required.
Live Metrics
Real-time refresh without page reloads. Your monitoring data is always current, even during active incidents.
Network Tracking
Active interfaces and IP assignments visible at a glance — always know exactly how your device is connected to the network.
All-in-One Dashboard
Hardware profile, network, process list, and uptime — everything in one view without switching screens or tools.
Plans
Start for Free. Scale as You Grow.
Business
Automate operations, manage fleets, and enable secure remote work for your entire team.
Try for Free
Private
Access your home devices, automate personal tasks, and share access with family — for free.
Freemium Plan Available
Research
Access lab hardware, automate data collection, and collaborate across institutions.
Request Free Usage